


Data analysis for institutions worldwide
Evidence your institution can defend
We turn complex data into clear, defensible evidence. Statistical analysis, modelling, data quality and reporting for the organisations whose decisions have to stand up to scrutiny, anywhere in the world. Auditable, documented, and yours to run after we leave.
Engagement intelligence, at a glance
Work delivered for and under
- A multilateral development agency
- A multilateral development bank programme
- A global development agency's multi-country programme
- International development organisations
Clients are described by class. Their names are shared privately on request, with their permission. A registered consultancy. CAC Business Name, BN 9574178, registered 26 May 2026. TIN 2623767560979.
Capabilities
From raw dataset to the decision it has to support.
Most practices hand you a chart and leave. We take the data you already have, clean and reconcile what needs it, run the analysis the question actually calls for, and wire the result to the systems your team already uses. Where a team is about to collect data, we build the digital instrument they collect with, so it comes in clean. One accountable party from raw data to clear decision.

Research and statistical analysis
The right technique, the assumptions checked, the result defensible.
Read more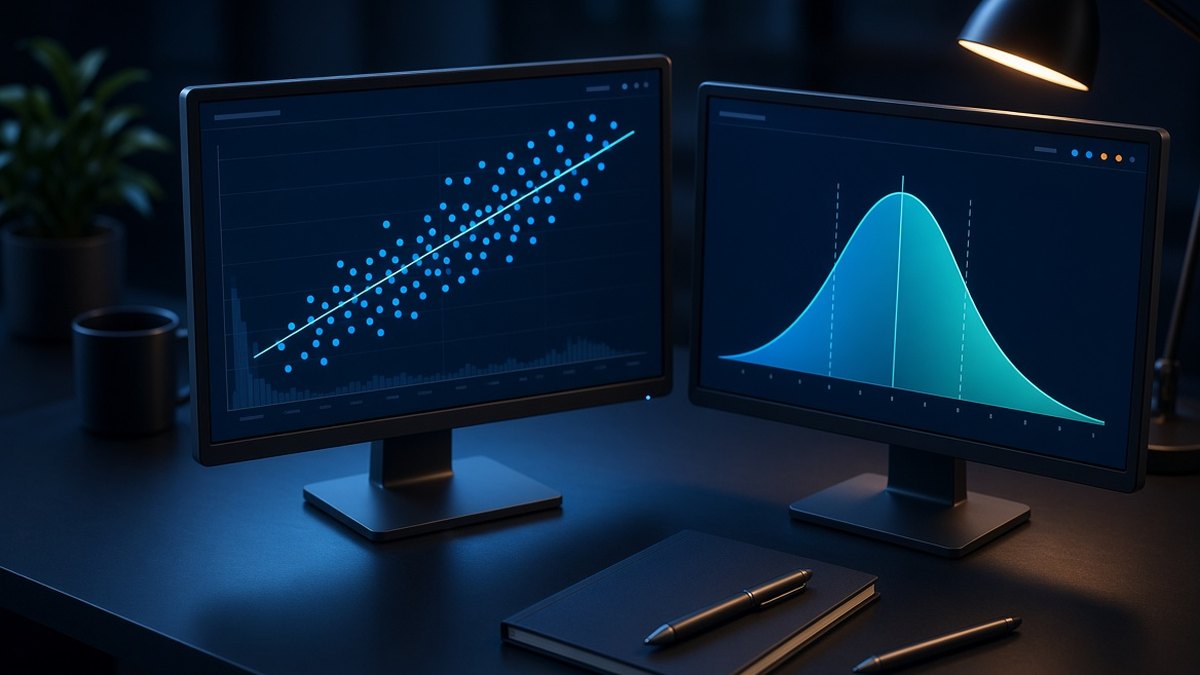
Data analysis
Answering the question your data was meant to answer.
Read more
Geospatial analysis and GIS
Your data placed on the map, so where becomes part of the answer.
Read more
Data management systems
Systems that keep your data correct after the consultant leaves.
Read more
Data collection tool development
The digital instrument your team uses to collect clean data from day one.
Read more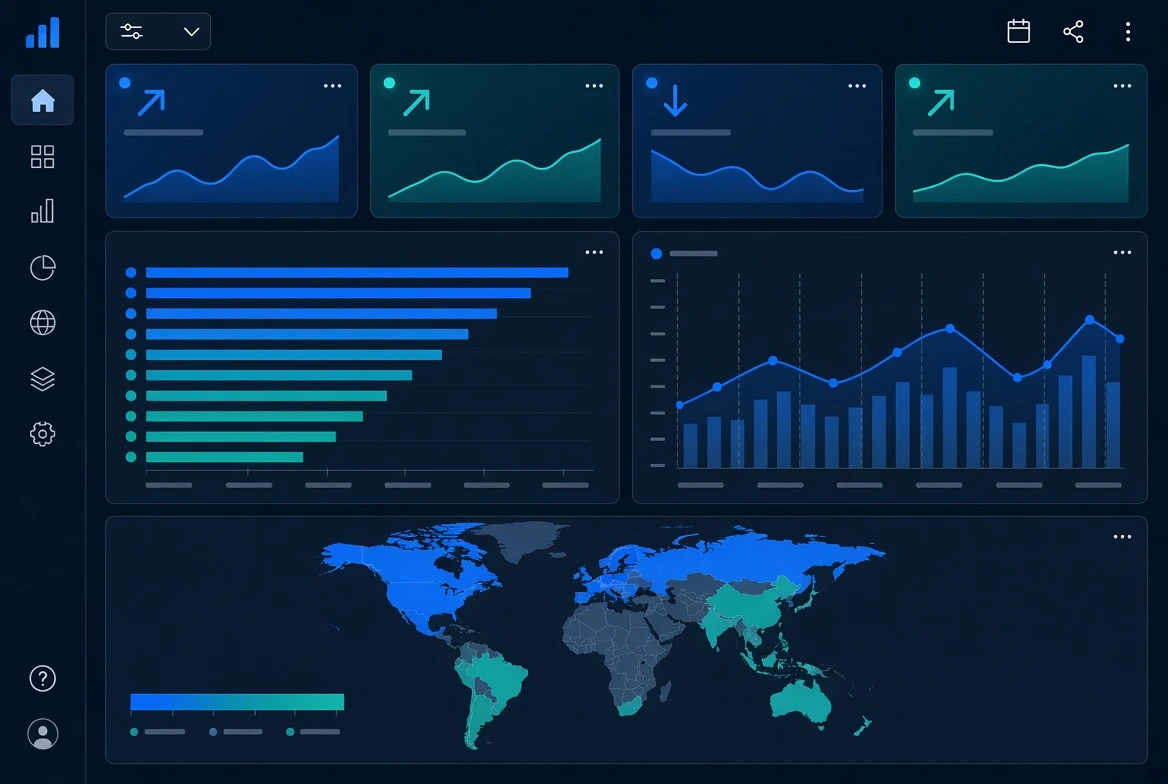
Dashboards and reporting
The numbers your team needs, in front of them, current.
Read moreA dashboard is only as good as the day it was refreshed. We build systems that read from your warehouse directly, so the number on the screen is the number in the database.
Michael Tobiloba Amunega, principal consultant
Learn the method
Build the skill yourself, in the methods we use on real work.
Practical, project based courses in statistics, SQL, data ethics and more. Start free, see exactly how the work is done, then take the full path when you are ready.

Data Ethics and Protection: Law, Rights and Responsible Practice
Learn what data protection law requires, the rights people have over their data, and how to work with data responsibly, taught through real cases, real fines and the laws of Nigeria, Europe and beyond.
$49 →
How Data Actually Works
A gentle, hands-on first course that shows you what data is, how a table is built, how to ask a question data can answer, and how to read a chart without being fooled.
Start free →
Principles of Statistics for Data Analysis
Learn to describe and picture any dataset honestly, reason with chance, use the normal curve where it fits, and judge where data came from, all in a spreadsheet.
$39 →Recent work
A sample of what we have built, and what it changed.

Two decision dashboards for a development programme team
Stakeholder monitoring and programme performance, built as dashboards a programme team can read without an analyst in the room.
Governance
Statistical analysis for a national disability inclusion study
The statistical analysis behind a national study on the cost of exclusion among persons with disabilities, turning a large dataset into evidence for policy.
Governance
Cross-country analysis for a continental impact evaluation
The data analysis for an impact evaluation spanning more than twenty African countries, from harmonising datasets to the benchmarks that guided funding.
GovernanceThe record
Figures from delivered work, not from a brochure.
Every number here comes from a project on the principal consultant's record and can be evidenced on request. Where a result has not been measured, this site leaves the space empty rather than estimating one.
How we work
Three steps, and you own everything at the end of them.
-
01 / SCOPE
Start with the decision
Before touching a spreadsheet we agree what has to be decided, and what would count as evidence for it. Most bad analysis begins here, answering a question nobody actually asked.
-
02 / BUILD
Do the unglamorous part properly
Cleaning, reconciling, checking. Names spelled three ways. One place recording a value one way, another differently. Two systems holding numbers that will not agree. This is where the value actually lives.
-
03 / HAND OVER
Leave something you can rerun
The result arrives with the code, the method and the audit trail attached. Run it again next quarter with fresh numbers, without calling us back.
Our view
Why programme dashboards go stale, and what to do about it
Almost every monitoring dashboard in the development sector is a photograph of a spreadsheet. Somebody exports the data, cleans it, loads it, and publishes. It is accurate on the day it is built and slightly wrong every day after that. By the quarterly review, the figures on the screen describe a programme that has already moved on.
The fix is not a better chart. It is an architecture where the dashboard reads from the warehouse rather than from a copy of it. That is the approach we take for live monitoring: the dashboard queries the client's BigQuery warehouse directly, so when the underlying data changes, the picture changes, and nobody has to remember to refresh anything.
The question is never whether the chart is pretty. It is whether a director can point at a figure in a board meeting and know it was true when the meeting started.
Getting there means the unglamorous work has to be right first. Data arrives from many hands and many systems, recorded inconsistently, and it rarely lines up on its own. One place records a name one way, another records it differently. Treat them as two things and a figure quietly drifts. None of that shows up in a chart. It shows up in a decision that was slightly wrong, made confidently.
So the work starts with the data itself: cleaned, reconciled and validated before a single figure is reported. On a national dataset covering 37 regions, that discipline is what produced analysis the client could stand behind, rather than a cleaning exercise that ran for months.
The tools follow the problem, never the other way round. Python and R for analysis. Stata and SPSS where your team already lives there. SQL, MySQL and BigQuery for anything that has to persist. Power BI or a web dashboard for the people who need to see it. And when the honest answer is a system rather than a report, we build the system.
Sectors
Where good data changes real decisions.
Honest boundaries
We are not for everyone, and that is the point.
A good fit if
- The figure will be scrutinised, and it has to hold up under scrutiny.
- The data is spread across systems that disagree with each other.
- You need the system to keep running after the consultant leaves.
- You would rather hear an uncomfortable finding early than late.
Probably not if
- You need a number that supports a conclusion already reached.
- You want every metric on one dashboard, with no clear owner.
- The deadline is tomorrow and the data does not exist yet.
- Price is the only thing being compared.
Due diligence
What procurement asks before they engage us.
Who actually does the work?
Have you handled work at national scale before?
Can you work with our existing data warehouse?
What do we own at the end?
Why will you not name most of your clients?
How do payments work?
Can you work with data containing personal information?
What if the data cannot answer our question?
Have a problem worth solving?
Tell us what you are working with and what decision it has to support. If we are not the right fit, we will say that too, and point you at someone who is.